Middleware Management with Oracle Enterprise Manager is now available. You can purchase this book from Amazon.com at http://www.amazon.com/Middleware-Management-Enterprise-Manager-Control/dp/1847198341
Monday, December 7, 2009
Friday, July 24, 2009
Monitoring Apache Http Server from Enterprise Manager
Enterprise Manager Grid Control allows monitor Generic Apache Http Server. In this blog, I will outline the steps required to discover Apache Server.
Note that if you are using Oracle Http Server you do not have to go thru this process and it is automatically discovered and EM provides better management capabilities for Oracle Http Sever.
In order to discover Apache Http Server, you have to have navigate to the Agent Page for the host where Apache Http Server is running and then select Add Apache Http Server as shown in the figure below:
You will be prompted with the discovery page as shown in the following figure.
You have to enter the details for the http server. Only the config file directory and bin directory are required. The other parameters are optional and required only when you want to use End-user Monitoring feature. Oracle recommends to use another product named Oracle Real User Experience Insight to monitor end-user experience.
After you complete these details, the Apache Http Server will be discovered.
You can monitor the Apache Http Server as shown below:
This is really helpful for customers who use Apache Server alonghwith WebLogic Server.
Have a nice weekend!
Tuesday, June 2, 2009
WebLogic Management Technical Whitepaper
Oracle Enterprise Manager Grid Control provides a comprehensive management solution for Oracle WebLogic Server. You can read the latest technical whitepaper to learn how you can use Oracle Enterprise Manager Grid Control to manage multiple domains of Oracle WebLogic Server.
Tuesday, March 3, 2009
Enterprise Manager Grid Control 10gR5 Released!
Oracle Enterprise Manager 10g Release 5 Enhances Support for Oracle Fusion Middleware, extending management capabilities to Oracle WebLogic Server, Oracle Service Bus, Oracle Coherence and Oracle Beehive. Read the complete news release here for details.
We will discuss more about these features in future posts.
Friday, January 16, 2009
Generating Availability History Report for WebLogic Server
You may have a requirement to view availability history for your target e.g. WebLogic Server. How do you do that? Oracle Enterprise Manager Grid Control 10g stores the availability history in its repository and provides two simple ways to generate reports.
If you want to see the availability history in last week or month then you have to click on the availability % link in the home page 
You will get the availability history for WebLogic Server for the desired period.
You want the availability report in a more customized period e.g. a year or between specific dates you can get it by selecting reports menu at the top and then selecting availability History report.
Then select your target name and desired period and you will see the report! You can customize the report too.
Hope this helps!
Monday, October 20, 2008
Setting EMAIL Notification for WebLogic metric alert
In my last blog entry, I outlined the steps for creating a metric alert for WebLogic Server. In this entry, I will outline steps required to create a notification such as email.
Setting Up Notification Methods
Click on Setup option at then top and then select the Notifications Method on the left and you will get the following page:
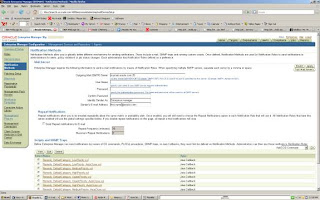
Enter the SMTP server and other properties required in your environment and click Apply. If you want to make sure that you have entered the correct properties click on Test Mail Server and you should get a test email from Enterprise manager.
Setup EMAIL Preferences for Admin User
Click on Preferences on the top and enter the email address assigned for the admin account as shown below. You have more than one email address for an admin user.
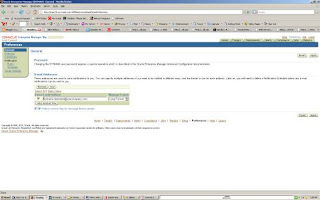
Setting the Notification Rules
1. Click on Rules on the left and you will get the screen with all notification rules.
2. We want to create a new notification rule for the alerts on WebLogic server. Click on create button and enter as details.
Change the target type to WebLogic Managed server and add the managed targets if you want the rule for specific WebLogic Server instances as follows:
3. Click on Availability Tab and select the options when you want to be notified e.g. when Server goes down.
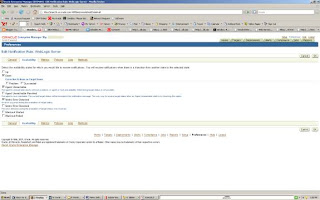
4. Click on Metrics Tab and click on add metrics and select the metrics you are interested in.
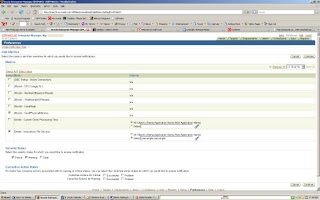
Make sure to select the severity Critical/Warning/Clear when you want to be notified.
5. After you confirm the metrics you will see the list of metrics that you have selected for notification as follows:
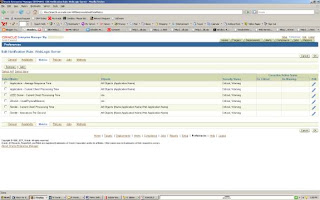
6. Optionally you can select a policy violation for notification.
Once you confirm the notification rule, it will be created!
7. If an alert occurs you will get an email as follows:
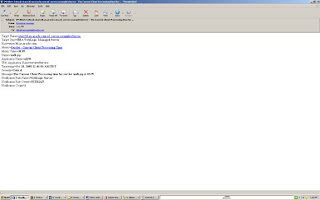
Enterprise manager also allows to setup notification schedule and blackouts! It also allows you send SNMP traps or allow you to integrate ticketing system such as Remedy or Siebel Helpdesk for sending notifications.
Setup metric alert for WebLogic Server from Enterprise Manager
It was great to meet you some of you during my OOW presentations.
Some of you wanted to setup metric alerts for a specific WebLogic Server metric and want to be alerted when a metric threshold is reached. For example you are using JRockit as your JVM and you want to be alerted when the physical memory usage reaches a specific level e.g. 800MB. Similarly, you want to be alerted when the invocation time for any Servlets/JSPs is higher than your expectation level.
1.Navigate to the Home Page of your WebLogic Server
2. Click Metric and Policy Settings on the WebLogic Server Home Page and you will get the follow screen. This will display the page that will show any existing policy settings
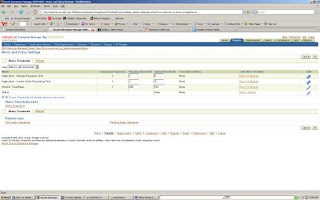
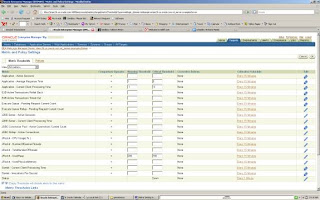
4. You can change the warning and critical thresholds of metrics that you want to monitor as follows and click ok ands you will get a confirmation that update was successful.
You will get alerts as shown in the following home page (under metric alert) when such an event occurs:
5. You can drill down a particular event by clicking on the alert text and you can see the details of the metric alert as follows:
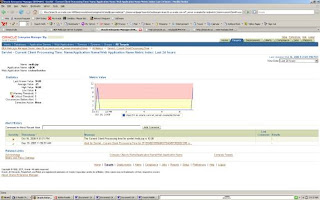
You can acknowledge and clear the event or add a comment from this page.
In my next blog entry, I will discuss how to setup a notification for the metric alerts.


