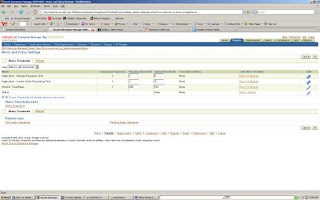
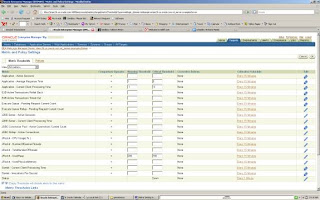
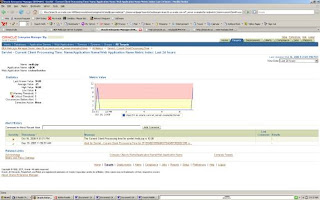
In my last blog entry, I outlined the steps for creating a metric alert for WebLogic Server. In this entry, I will outline steps required to create a notification such as email.
Setting Up Notification Methods
Click on Setup option at then top and then select the Notifications Method on the left and you will get the following page:
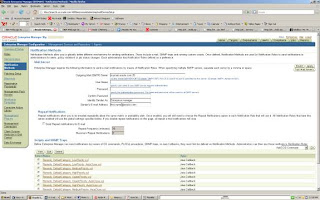
Enter the SMTP server and other properties required in your environment and click Apply. If you want to make sure that you have entered the correct properties click on Test Mail Server and you should get a test email from Enterprise manager.
Setup EMAIL Preferences for Admin User
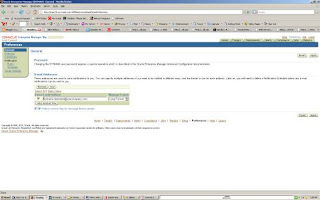
Click on Preferences on the top and enter the email address assigned for the admin account as shown below. You have more than one email address for an admin user.
Setting the Notification Rules
1. Click on Rules on the left and you will get the screen with all notification rules.
2. We want to create a new notification rule for the alerts on WebLogic server. Click on create button and enter as details.
Change the target type to WebLogic Managed server and add the managed targets if you want the rule for specific WebLogic Server instances as follows:
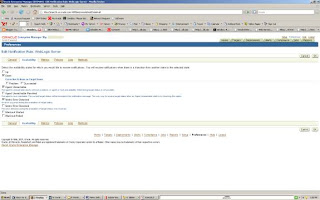
3. Click on Availability Tab and select the options when you want to be notified e.g. when Server goes down.
4. Click on Metrics Tab and click on add metrics and select the metrics you are interested in.
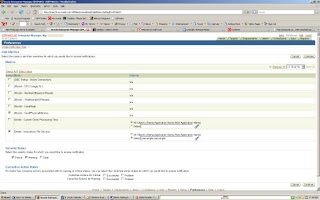
Make sure to select the severity Critical/Warning/Clear when you want to be notified.
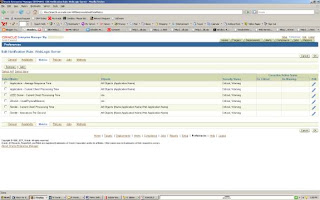
5. After you confirm the metrics you will see the list of metrics that you have selected for notification as follows:
6. Optionally you can select a policy violation for notification.
Once you confirm the notification rule, it will be created!
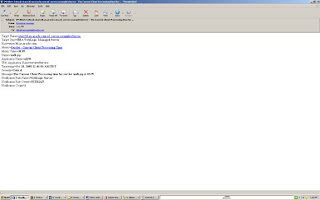
7. If an alert occurs you will get an email as follows:
Enterprise manager also allows to setup notification schedule and blackouts! It also allows you send SNMP traps or allow you to integrate ticketing system such as Remedy or Siebel Helpdesk for sending notifications.


