It was great to meet you some of you during my OOW presentations.
Some of you wanted to setup metric alerts for a specific WebLogic Server metric and want to be alerted when a metric threshold is reached. For example you are using JRockit as your JVM and you want to be alerted when the physical memory usage reaches a specific level e.g. 800MB. Similarly, you want to be alerted when the invocation time for any Servlets/JSPs is higher than your expectation level.
1.Navigate to the Home Page of your WebLogic Server
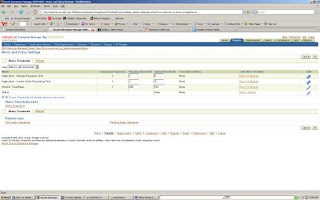
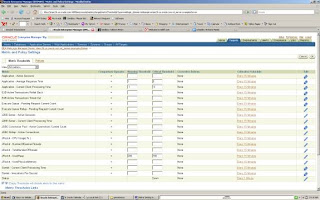
2. Click Metric and Policy Settings on the WebLogic Server Home Page and you will get the follow screen. This will display the page that will show any existing policy settings


4. You can change the warning and critical thresholds of metrics that you want to monitor as follows and click ok ands you will get a confirmation that update was successful.
You will get alerts as shown in the following home page (under metric alert) when such an event occurs:
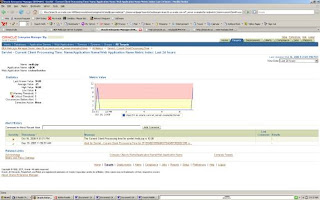
5. You can drill down a particular event by clicking on the alert text and you can see the details of the metric alert as follows:

You can acknowledge and clear the event or add a comment from this page.
In my next blog entry, I will discuss how to setup a notification for the metric alerts.

No comments:
Post a Comment